For this analysis we used the publicly available KNMI data on heatwaves. The relevant categorizations, based on temperature, are summer days (+25°C); tropical days (+30°C); and extreme tropical days (+35°C).
Looking back on the past century, the 10-year average number of summer days (+25°C) has more than doubled: from 12.9 days in 1920 to 28.9 days in 2020.
In 2018 there were a record total of 55 summer days, while a year later we experienced three consecutive extreme tropical days with +35°C temperatures. A record number of tropical days were measured in 1976, with a total of 14 days with +30°C temperatures.
Heatwave records
Talking about rising temperatures, how about we zoom in on heatwaves in the Netherlands?
In the Netherlands, the hottest heatwave occurred in July 2019. Back then, a highest maximum temperature of 37.5°C was measured in De Bilt – this was almost 2 degrees higher than the previous absolute temperature records measured during the heatwaves of 2006 and 2018. This heatwave of 2019 however lasted “only” 6 days.
The longest official heatwave occurred in 1975: from July 29th to August 15th. It lasted 18 days and had an average maximum temperature of 29.2°C during that time.
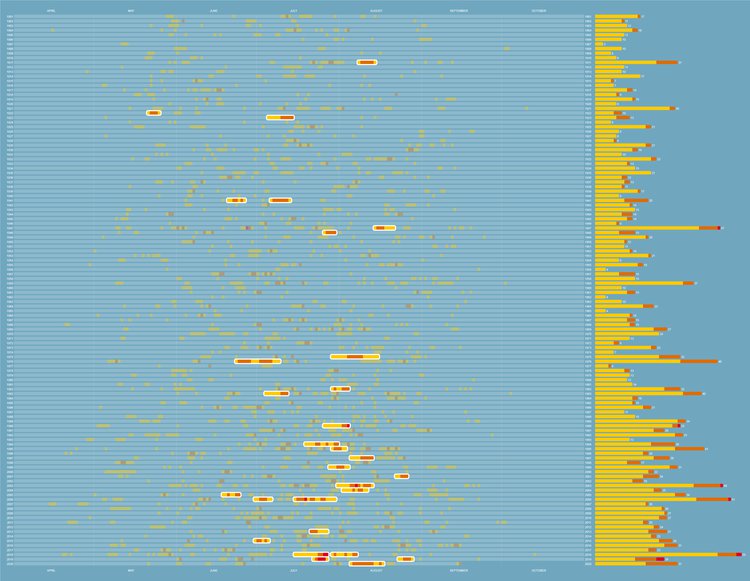
100 years of Dutch summers: The clock is ticking on climate change
“What is notable: this year the weather forecast already predicted the last heatwave 10 days ahead! The heatwave of 2018 was also expected at an early stage. Heatwaves therefore seem very predictable. This is helpful for all kinds of operational services – e.g. GGD, Waternet – in the city to prepare accordingly and take timely measures.”
The summer of 2020
Overall, this summer ends in 6th place in the list of hottest summers since 1901 according to the Dutch Meteorological Institute (KNMI). A total of 28 summery (+25.0°C) and 11 tropical days (+30°C) were measured in De Bilt** – in comparison to national averages of 21 summer and 4 tropical days.
What was particularly noticeable with regard to this summer’s heatwave was its persistence. The nationwide heatwave started on August 5th and lasted 13 days in total. The heatwave was characterized by an unprecedented streak of 8 tropical days (+30°C). The previous record was 6 days in a row, in the summers of 1941 and 1975. Also, in 1976 a heatwave took place with 10 tropical days – this however was not a continuous series.
“The total length of the heatwave in August this year was striking. Also, nighttime temperatures were considerably high – even when the heatwave ended these temperatures dropped slowly.”
A map to ‘find your cool’ in Amsterdam
So, where to cool off in the city when temperatures are rising? Together with the City of Amsterdam, Witteveen+Bos, and CLEVERºFRANKE, AMS Institute created this online map for Amsterdammers to discover places in their neighborhoods to 'chill out'. To illustrate, did you know that it can be up to 2 degrees cooler in Amsterdamse Bos than in the rest of the city?
The map also indicates where it has been relatively quiet or busy (in terms of crowds) in recent weeks. This way you can find a cool(er) and quiet place in the city.
Amsterdam's urban heat-island almost 50 stories high
In general, cities are found to be warmer than rural areas. In the city, heat is trapped in stones, roads and buildings, and the city itself produces a lot of heat.
Diving into this topic, during the heatwave of July last year, researchers from Wageningen University & Research and AMS Institute launched weather balloons from Dam Square to map the height of the urban dome.
“It is often underestimated how much impact heat stress has on, for example, the vitality and productivity of inhabitants. Understanding the urban climate and the predictability of a city's weather profile is therefore becoming increasingly important.”
Gerben Mol
Program Developer Climate Resilient Cities

Amsterdam climate-proof by 2050
Higher temperatures, among others, present challenges to the quality of city life. Also, heatwaves like the one we experienced last August are expected to occur more frequently due to climate change. Amsterdam is aware of this, and is committed to becoming as climate-proof as possible by 2050.
To foster these developments and connect them to the state-of-the-art knowledge from science, our Climate Resilient Cities research program evaluates the functioning, adaptation and resilience of climate systems.
Furthermore, we design, develop and study methods and tools for urban data processing, visualizations, and applications. Data are at the core of understanding the city, and help with urban planning and decision making.
A few notes:
* The ‘astronomical summer’ this year runs until September 22, 3:31 PM. Then autumn begins. The ‘meteorological summer’ has already come to an end. The meteorological autumn started on September 1. These meteorological seasons are intended to make calculations easier with weather data. The position of the earth in relation to the sun determines the actual seasons.
** A regional heat wave occurs when it reaches 25 degrees or warmer in a specific area for at least five days in a row, with the temperature even rising to a minimum of 30 degrees on three days. To be able to speak of a national heat wave, this must be the case specifically in De Bilt.
Sources used as inspiration for this news article: KNMI Zomer 2020 (in Dutch), Het Parool (in Dutch).