The past few days have been tropically warm in the Netherlands. In fact, a new national weather record has been set, as we've experienced 8 consecutive tropically warm days of 30 °C and higher.
This heatwave - in the Netherlands defined as a series of at least 5 summer days (+25 °C) of which at least 3 are tropically warm (+30 °C) - is expected to last until Friday.
This online map provides Amsterdammers with spots in their neighborhoods where they can find some relief from the warmth. To illustrate, did you know that it can be up to 2 degrees cooler in the Amsterdamse Bos than in the rest of the city?
The map also indicates where it has been relatively quiet or busy (in terms of crowds) in recent weeks. This way you can find a cool(er) and quiet place in the city.
Screenshot Wednesday afternoon Aug 12th | This map (in Dutch: 'Koele Plekken Checker') is designed by the City of Amsterdam, Witteveen+Bos, CLEVERºFRANKE and AMS Institute
Screenshot Thursday morning Aug 13th | This map (in Dutch: 'Koele Plekken Checker') is designed by the City of Amsterdam, Witteveen+Bos, CLEVERºFRANKE and AMS Institute
“It is often underestimated how much impact heat stress has on, for example, the vitality and productivity of inhabitants. Understanding the urban climate and the predictability of a city's weather profile is therefore becoming increasingly important.”
Gerben Mol
Program Developer Climate Resilient Cities

Real-time data that indicates how warm it feels
The map, created together with the City of Amsterdam, Witteveen+Bos, and CLEVERºFRANKE, is made up of two parts: 1) information about the 'wind chill' (i.e. how warm it feels) and 2) information about relative crowdedness in the city.
- Real-time city temperatures
The map uses an algorithm that was previously developed by the Meteorology and Air Quality Group of Wageningen University & Research (WUR) together with engineering & consultancy firm Witteveen+Bos and Royal Netherlands Meteorological Institute (KNMI). This method was created to provide insights into the risks from heatwaves at the urban district level, which creates possibilities to take targeted local measures, based on (static) visuals.
For this map, Witteveen+Bos further developed the aforementioned. Now, the algorithm provides Amsterdammers with a real-time indication on 'wind chill' temperatures in the city based on open meteorological data from KNMI.
Please note: the wind chill temperature is slightly different from the air temperature. The air temperature is measured in a weather station. The wind chill indicates how people perceive temperatures. For example, if the measured air temperature is 30 ºC, in the sun and out of the wind it may feel like +40 ºC.
2. Relative crowdedness
Furthermore, the existing 'busy places map' made by the City's Corona Crisis Team has also been included. The map shows where in the city it has been relatively quiet or crowded in recent weeks. Please note: this is not real-time information, therefore actual crowdedness can deviate from the situation on the map at times.
Ultimately, combining these two components, this map provides Amsterdammers with information where to find a cool place in the city and where it has been relatively quiet or busy in terms of crowds to be able to respect the social distancing rules in place at their chosen 'chill out' location.
This map (in Dutch: 'Koele Plekken Checker') is designed by the City of Amsterdam, Witteveen+Bos, CLEVERºFRANKE and AMS Institute
“This algorithm provides Amsterdammers with real-time and detailed information on perceived temperatures in the city. By working together with our academic and private partners and the municipality, we could translate the scientific achievement of the algorithm into a use case for the city and its citizens. We hope to learn from people using this checker to develop more uses for the insight the algorithm gives us.”
Caspar Egas
Research Engineer

Amsterdam's urban heat-island almost 50 stories high
In general, cities are found to be warmer than rural areas. In the city, heat is trapped in stones, roads and buildings, and the city itself produces a lot of heat. Diving into this topic, during the heatwave of July last year, researchers from Wageningen University & Research and AMS Institute launched weather balloons from Dam Square to map the height of the urban dome.
The results of the measurements show that in the evening the heat of the city impacted temperatures up to a height of 120 meters (about 50 stories high). Also, in the evening it remained 3.4 degrees warmer in the city than the countryside.
In addition, in the city it took longer for the heat to dissolve and at 10PM sensors on the weather balloon still recorded a temperature of 26.3 ºC at the Dam Square. The temperature measured at the same time on the countryside was a full 3 ºC lower. This shows how the heat creates a 'lid on the city' that traps air pollution in the city.
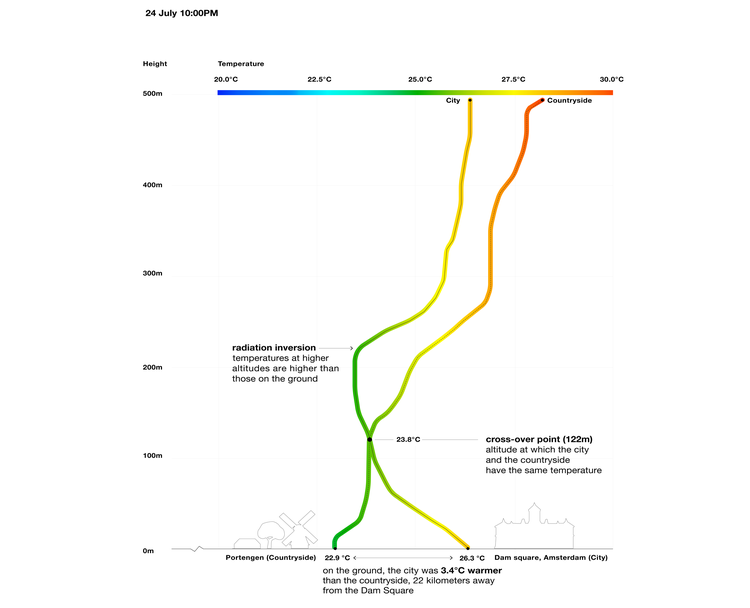
The visualization shows to what height the urban heat effect impacts the temperature of the atmosphere. In the evening at 10PM the heat of the city - the so-called urban dome – still reaches a height of 120 meters ©CleverFranke/AMS Institute
This visual shows the city's maximum temperatures on July 25th, 2019 measured by the weather stations located throughout Amsterdam ©AMS Institute
Amsterdam climate-proof by 2050
Heavier rainfall and storms, higher temperatures, rising sea levels, drought and other climate change consequences all present challenges to the quality of city life. Moreover, due to increasing urbanization the number of people having to deal with these consequences is also growing. As a result, cities across the globe need to prepare for the impact of climate change on urban life. Amsterdam is aware of this, and is committed to becoming as climate-proof as possible by 2050.
To foster these developments and connect them to the state-of-the-art knowledge from science, our Climate Resilient Cities research program evaluates the functioning, adaptation and resilience of climate systems. The entire urban air-water-soil-green system is analyzed, to map rainfall, temperature and wind turbulence in and around Amsterdam. We then use this information to create a climate adaptation planning approach that carefully designs and assesses interventions such as greening and the sustainable (re)design and maintenance of the city’s infrastructure.
Press contact:
For questions regarding this map, please contact the Press Officer of the City of Amsterdam:
Nika Haspels
+31 6 83640524
N.Haspels@amsterdam.nl