The maritime climate for which cities in the Netherlands were built no longer exists. It suited centuries of brick architecture, office buildings, and postwar urban planning. In 1950, Amsterdam experienced fewer than 10 summer days above 25°C. But by 2085, projections warn the city might endure 40 such days. The Atlantic Meridional Overturning Circulation (AMOC) ocean current system, which has kept northwestern Europe temperate for millennia, could collapse — bringing both extreme summer heat and dramatically colder winters to a region utterly unprepared for both.
This is not a distant problem. Amsterdam's brick and concrete trap heat like a storage battery. The city runs 2-3°C warmer than the surrounding countryside by day, and up to 10°C warmer at night. Recent measurements of 100 Amsterdam homes revealed the crisis: during a mild September heatwave when outdoor temperatures barely reached 30°C, 15% of homes exceeded that temperature indoors. In three-quarters of city homes, nighttime temperatures surpassed the WHO-recommended maximum of 24°C.
Such prolonged heat exposure influences mood, productivity, stress levels, and sleep. For elderly or sick residents who spend most of their time indoors, it can be deadly. One AMS Institute study recorded an apartment in a glassy residential tower hitting 42°C when it was only 26°C outside. Heat lingers in modern, well-insulated homes for up to five days during a heatwave.
i-Tree 2.0-NL: Shady Solutions
Trees have long been valued for their ability to cool cities during heatwaves. Nature’s canopies intercept sunlight, preventing pavements and soil from heating up. Yet, despite their promise as cheap climate adaptation infrastructure, urban trees remain underused. The problem is partly a lack of data to quantify their cooling effect, and partly the absence of practical tools for city planners to deploy them effectively.
A Dutch project called i-Tree 2.0-NL is changing that. The initiative builds on i-Tree, a US Forest Service software that analyzes urban forests. The Dutch version provides precise measurements of how Dutch trees perform in hot weather, identifies which species cool best, and translates findings into practical applications for landscaping cooler neighborhoods.
Orchestrating the Urban Forest
AMS Institute and Stadswerk—a knowledge network specializing in climate and mobility in public spaces—drove the project initiative forward and obtained funding from ClickNL, the knowledge institute of the Topsector Creative Industries, which supports design-driven approaches to societal challenges. This success raised interest across their joint networks, ultimately assembling an unprecedented consortium of 28 partners.
This includes scientific research institutions (TU Delft, WUR, USDA Forest Service), data and technology specialists who've mapped over 100 million Dutch trees via satellite (Cobra Groeninzicht, Davey Institute), tree consultancies with decades of on-the-ground experience (Terra Nostra, Plantkundig), internationally renowned design firms (MVRDV, Arcadis), tree nurseries shaping tomorrow's urban canopy, and eight municipalities. Because this represents the complete value chain of urban forestry in the Netherlands, the science will actually transform how cities design and manage in practice.
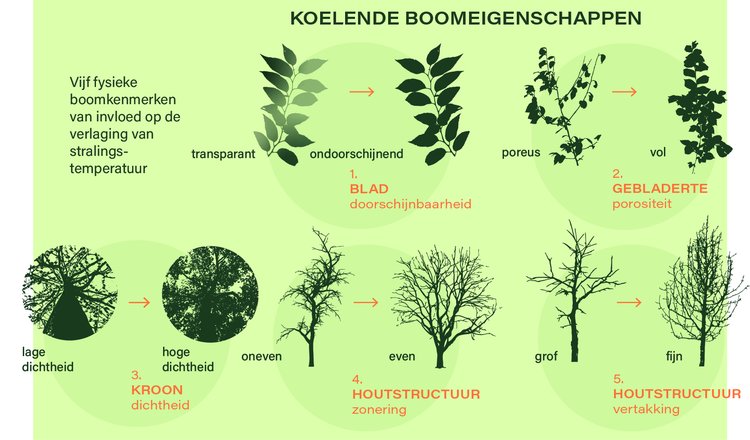
The research examined 70 tree species commonly found in Dutch cities, representing 80-90% of urban trees. Coordination among eight municipalities—Amsterdam, Rotterdam, The Hague, Utrecht, Groningen, Dordrecht, Dijk en Waard, and Hendrik-Ido-Ambacht—provided the real-world laboratories where theory met practice. Researchers identified five key physical traits determining cooling capacity: crown density, wood zoning, foliage porosity, foliage trans-luminescence, and wood grain. These combine into 51 distinct "cooling architecture types"—a practical shortcut for planners selecting trees without memorizing hundreds of individual species' characteristics.
Cooling traits of leaves
With research by René van der Velde (Associate Professor Urban Forestry, TU Delft), Rebecca Price (Transition Design), and Marjolein van Esch (Environmental Technology), the team conducted extensive field measurements across multiple years in climate arboreta and real urban settings. External partners brought specialized expertise. For example, Cobra Groeninzicht used satellite imagery to catalogue over 100 million trees across the Netherlands, and MVRDV demonstrated how to integrate findings into actual urban design.
Lofty Impacts
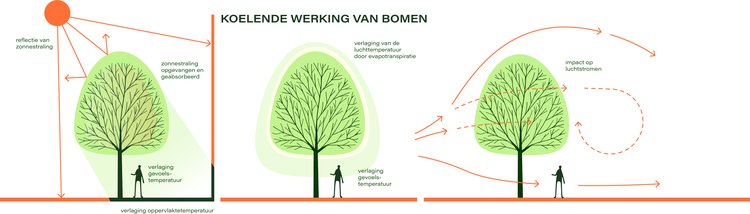
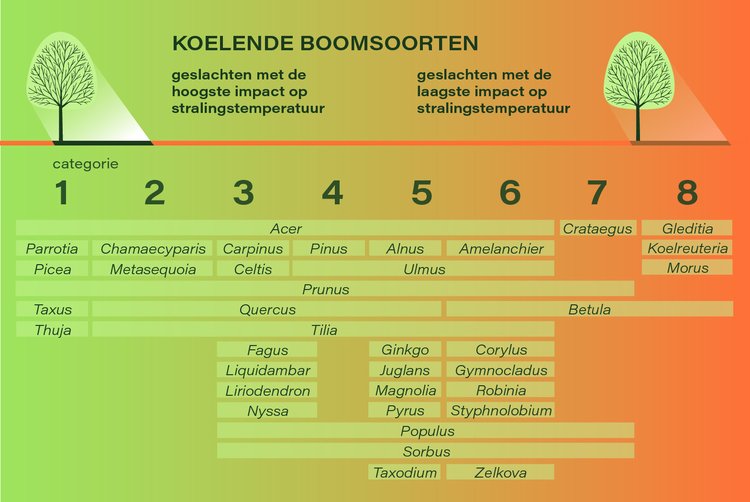
While all analyzed trees provided cooling, differences between species such as linden, chestnut, birch, beech, pedunculate oak, common ash, or Norway maple were significant. Trees reduce air temperature by an average of 2.6°C through evapotranspiration (releasing water from their leaves). But the most dramatic effects came from shading.
“Trees can also cool medium radiant temperature (the heat reflecting off impervious surfaces in cities) by 34.5°C, on days when those radiant temperatures exceed 50°C,” said Rebecca Price, Assistant Professor of Transition Design and Master Programme Director of Strategic Product Design at Technische Universiteit Delft. Price was involved in planning aspects at testing at the Marineterrein.
We now also understand tree growth curves in the Netherlands better than ever before. Terra Nostra contributed ecosystem services knowledge and led studies on how fast different species grow in time. Using data from the participating municipalities in combination with remote sensing measurements, “Scientifically this is an interesting result, never done before on this scale, using data from many municipalities in combination with remote sensing measurements,” said Henk Wolfert, AMS Institute Program Developer, Climate Resilient Cities.
How trees cool the city
Location matters enormously. Trees planted in parks and on permeable surfaces grow substantially faster and deliver cooling benefits much earlier than those squeezed into narrow concrete sidewalk cutouts. This challenges standard urban tree planting practices and suggests cities should prioritize boulevard-style street plans that give trees room to thrive.
Trees take 15-30 years to reach full cooling capacity. Every year, urban planners delay making strategic decisions about which trees to plant that will affect urban heat in the 2040s and 2050s, precisely when Amsterdam will need that cooling infrastructure most. Lindens have larger crown density and therefore provide more shade than elms, for example.
But even among trees, there are hierarchies. Chestnut leaves are darker than those of the linden and hang closer together on the branches. This gives the chestnut a smaller foliage porosity, which means the canopy of a chestnut is denser than that of a linden. "Under that tree it's really dark," says project leader René van der Velde, AMS Principal Investigator, and TU Delft Associate Professor of Urban Forestry. "And therefore it's also nicely cool there."
Applications Rooted in Research
With €800,000 in funding, the initiative developed sophisticated tools to measure how different tree species cool cities and reduce building energy demand and indoor temperatures. The results are reshaping urban planning across the Netherlands, transforming trees from decorative afterthoughts into climate adaptation infrastructure.
Architecture firm MVRDV's redesign of the Marineterrein district exemplifies this approach: rather than planning buildings first and fitting trees into leftover spaces, they designed around existing trees, treating the urban forest as primary infrastructure. The Festival Op de Ring experiment—placing 750 trees along Amsterdam's A10 highway for the city's 750th anniversary—demonstrated these principles at scale, transforming a heat island into a climate-adaptive green corridor.
Cooling tree species
Adding Depth Through Design
Sanne Keizer, who graduated from TU Delft's Master's program in Strategic Product Design as part of the i-Tree 2.0-NL consortium, developed the Urban Forest Portfolio—a management dashboard that integrates the urban forest life cycle into planning, management, and design. The dashboard monitors both the ecosystem services and the life cycles of trees at the municipal and street levels, providing insights into species diversity, equitable distribution, and progress toward green ambitions.
Keizer's work addresses a critical gap in urban planning: static snapshots of large trees in architectural renderings and green space policies tied to four-year political cycles fail to account for the time dimension essential to forest development. The dashboard can compare trees in different urban scenarios—for instance, before and after an area development—making visible whether greenery was added or needs compensation.
Beyond the technical tool, Keizer's thesis proposed eight concrete practices for systemic change, including transparent citizen communication, new procurement rules, spatial input on tree performance, and long-term monitored targets for green infrastructure. Her work, including the design and compilation of the Public Report that synthesizes the i-Tree 2.0-NL project's collaborative research findings, exemplifies how the consortium's scientific work is being translated into practical applications (see https://komovo.nl/werk/i-tree) that could reshape how the Netherlands' cities treat urban forests as critical infrastructure—on par with water and road systems.
“With i-Tree, urban green shifts from a ‘decorative addition’ to critical infrastructure: trees gain measurable value in cooling, health, and climate adaptation—exactly what cities need to plan for the future.”
Sanne Keizer
Participating municipalities now have sophisticated dashboards that show which trees cool most effectively under their specific conditions. Tree nurseries have data to guide future cultivation and supply. Designers have frameworks for integrating green infrastructure from the earliest planning stages. And perhaps most importantly, citizens have scientific validation that their instinctive retreat to the shade is quantifiably beneficial, and that their future public green spaces will provide more of it in the future.
Read the entire Public Report "Publieksrapport Stadsbomen Tegen Hittestress i-Tree 2.0" on Open Research Amsterdam (in Dutch): https://openresearch.amsterdam/nl/page/132960/publieksrapport-stadsbomen-tegen-hittestress-i-tree-2.0
Read a summary of the report here (in Dutch): https://openresearch.amsterdam/nl/page/132962/samenvatting-stadsbomen-tegen-hittestress-i-tree-2