From March 15 till June 1, the government tightened national COVID-19 measures and announced a strict intelligent lockdown. Rules and regulations were loosened in June, and again stricter rules were introduced from October 2020 onwards.
Undoubtedly the lockdown has affected many of us on an individual level. Our data visualization team wondered… what is the impact of the lockdown on city life?
Cardboard and glass waste
With many stores closed during the lockdown, online shopping has boomed and so has the amount of cardboard waste. The City of Amsterdam experienced a big increase in cardboard waste – particularly in the summer and around the holiday season in December.
“On a regular Monday, about 78 tons of paper and cardboard are collected. In comparison: the Monday after Black Friday last November, this was 95 tons.”
Céline Heldring | Strategic advisor circular waste and resources | City of Amsterdam
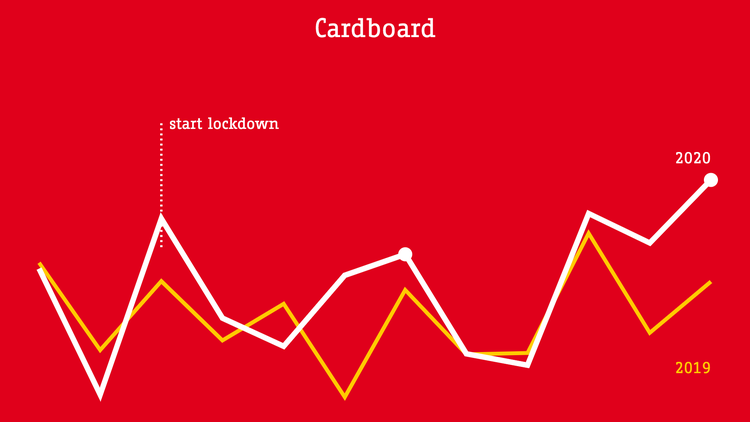
2020 vs 2019: Amount of cardboard waste collected in Amsterdam
During the strict lockdown from March to June, cafes, bars and restaurants closed their doors – except for take-away orders – and the amount of glass waste collected in Amsterdam increased. From June 1 till October, the restaurants and cafes reopened. From October 14 onwards, cafes, restaurants and bars closed again – explaining the second increase in glass waste.
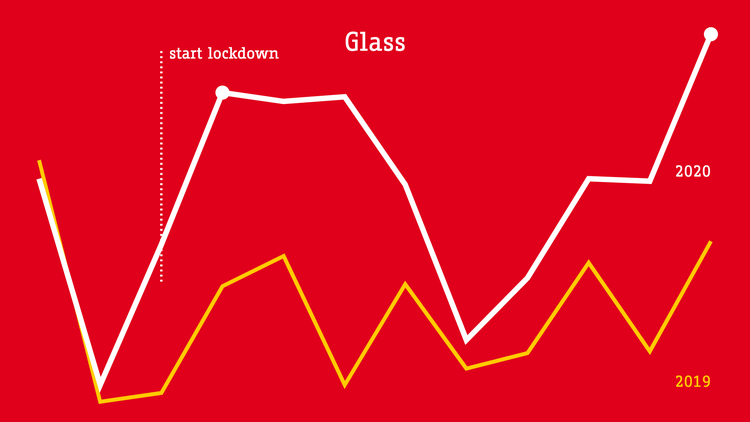
2020 vs 2019: Amount of glass waste collected in Amsterdam
“From June till October it was possible to meet outside with an unlimited number of people. Also, in June temperatures were a lot higher than average with many people meeting in parks for drinks. This could explain why the decline is not instantly as steep as expected.”
Tycho Levels | Intern Data Visualization | AMS Institute
Happiness levels and concentration problems
What about the impact of the lockdown on well-being in the Netherlands? Linked to a large-scale French study elaborated and launched by Lise Bourdeau-Lepage (2020), our Scientific Director Eveline van Leeuwen investigated this topic focusing on the Netherlands. The findings of the study indicate that our happiness levels are negatively impacted by the lockdown.
More specifically, city residents reported to be 16% less happy than before, whereas in rural areas the decrease was 12%. Furthermore, concentration, focus and sleep problems also increased. Again, people living in cities reported this increase to be higher (+17%) than people living in rural areas.
“Since the lockdown respondents from urban and rural areas both reported a significant drop in experienced happiness. This drop was bigger in urban areas, where people reported a 6.6 out of 10, down from a 7.9 out of 10. For rural areas the drop went from 8.1 to 7.1 out of 10.”
Car traffic, water usage and CO2 emissions
Firstly, looking at traffic data, the lockdown resulted in an immediate decrease of car traffic in the city. Comparing 2 main roads in the city center of Amsterdam – de Ruyterkade and the IJtunnel – shows an immediately decline of 46% in April 2020.
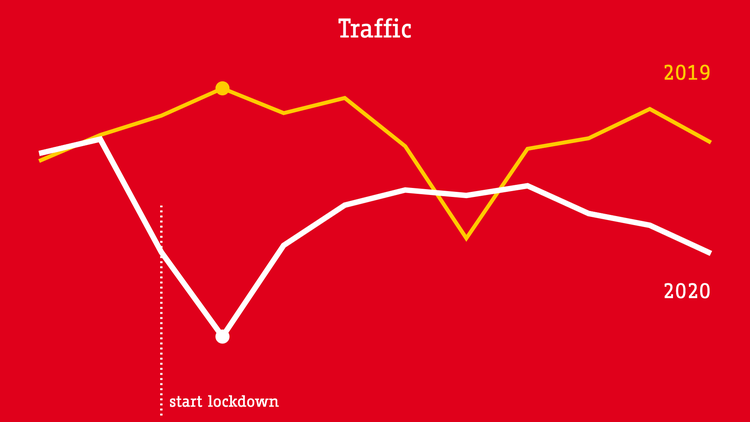
2020 vs 2019: Car traffic in the city center of Amsterdam
“What also struck us while plotting the data: the dip in August 2019. A possible explanation is: August is normally quieter due to holidays. This cycle was broken in 2020. By diving into the data, we discover these kinds of patterns that are interesting to investigate further.”
Caspar Egas
Research Engineer

Secondly, even though – based on a sample of Amsterdam households – it is found we have been using more water at home, water usage in the city as a whole dropped around 5% in 2020, compared to forecasts by Waternet.
Also, morning routines were affected by the lockdown: a sample population of households in the city showed the peak hours of morning water usage – when most people shower or wash up – were later and more spread out.
“Pre-lockdown we saw a high peaks for water usage between 6 and 8am. Data shows us that water usage peaked between 8 and 10am during the lockdown.”
Erik Boertjes
Former Data Visualization Engineer at AMS Institute

Lastly, measurements from a rooftop at Muntplein showed a reduction of CO2 emissions in the city air after the lockdown. The monthly average of CO2 emissions for May 2020 was over 50% lower than for May 2019.
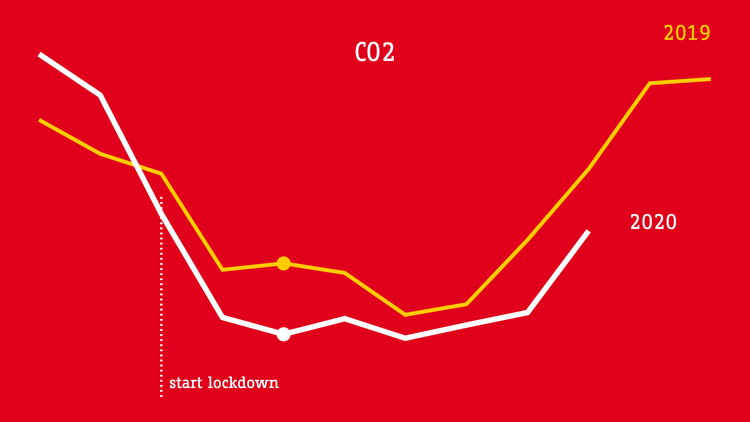
2020 vs 2019: CO2 emissions in Amsterdam
“Since April 2018, we’ve been measuring the CO2 flux in Amsterdam at Muntplein from a.o. traffic and heating of buildings from the city to the atmosphere. You can see that in Amsterdam the CO2 flux dropped during the strict lockdown. After this period, the CO2 emissions were still strongly reduced.”
Urban data to better understand city dynamics
Next to diving into data to investigate the impact of the lockdown on city life, urban data in general enables us to better understand urban dynamics. Ultimately, to develop solutions that address urban challenges and to create more resilient and just cities.
For this visualization our data team worked closely with among others our partners from the City of Amsterdam, Waternet, and researchers. See below for a list of sources used:
- Cardboard and glass waste – provided by the City of Amsterdam
- Happiness levels and concentration problems – Lise Bourdeau-Lepage and Eveline van Leeuwen, Hoe gaat het nu? Over welzijn en de lockdown (Also available in English)
- Car traffic – Open data from national portal for traffic data (NDW)
- Water usage sample Diemen-Noord measured in March and April 2020 – provided by Waternet
- CO2 emissions – Gert-Jan Steeneveld, Sophie van der Horst, and Bert Heusinkveld, Wageningen University, Meteorology and Air Quality Section